Industrial sector sees record-breaking capacity additions in 2019
In 2019, solar heat capacity additions reached record-breaking levels in industrial sectors around the world, coming to 251 MW in total. The countries at the top of the list were Oman (180 MW), China (53 MW), Mexico (3 MW), India (2 MW) and Germany (1 MW). Ranked by the number of new SHIP systems, China and Mexico were leading the field, at 26 systems each, followed by Germany with 11 new installations. These are some of the findings from the third SHIP survey carried out within Solar Payback. The about 80 industrial solar heat suppliers listed on the SHIP Supplier World Map were surveyed. The map which was created at the beginning of the Solar Payback project was updated and includes now all reference projects put up by the end of 2019. Two other news reports on the SHIP survey results can be found here: news 1 and news 2.
Photo: Solarlite
The technology solutions providers participating in the survey reported that overall, 86 systems came online in 2019. This was a bit below the number put up in 2018 (99 systems) and in 2017 (107 systems). The slowdown was mainly the result of a drop in new installations in Mexico (see table 2). The two previous surveys had the Mexican solar industry at the top of the SHIP rankings. But last year, it managed to install only 26 systems compared to 51 in 2018 and 36 in 2017. One reason for the lower interest in renewables throughout the industrial sector, according to Mexican suppliers, was the new government’s support for oil and gas. Other reasons were the delays in decision-making and contract awards by larger industrial clients.
| 2017 | End-of-year total | 2018 | End-of-year total | 2019 | End-of-year total | |
| No. of commissioned SHIP systems | 107 | 632 | 99 | 731 | 86 | 817 |
| Newly installed collector area [m2] | 219,280 | n/a | 55,583 | n/a | 358,641 | n/a |
| Newly installed solar thermal capacity [MW] | 153 | 39 | 251 |
Table 1: Trends in the global SHIP market between 2017 and 2019. The large fluctuations in added capacity were the result of how the Miraah project is being implemented in Oman, as solar steam capacity was added during multiple stages, i.e., 120 MW in 2017 and 180 MW in 2019. The figures for 2018 had to be updated because five projects in India had been postponed to 2019 or later.
Source: Solar Payback SHIP Supplier Surveys 2017, 2018 and 2019
By contrast, Chinese turnkey system suppliers completed a decent number of projects in industry in 2019, as the total went up from 15 in 2018 to 26 last year. The Chinese SHIP market is most probably much larger than the survey suggests. Even though local engineering firms use collectors from large manufacturers for industrial systems, some of these systems are not included in the figures supplied by the sales departments of larger Chinese companies participating in the SHIP Supplier World Map survey.
| No. of systems put up in 2018 | Collector area added in 2018 [m2] | No. of systems put up in 2019 | Collector area added in 2019 [m2] | Average system size in both years [m2 per system] | |
| China | 15 | 28,813 | 26 | 76,182 | 2,561 |
| Mexico | 51 | 6,898 | 26 | 4,040 | 142 |
| Germany | 9 | 1,589 | 11 | 1,470 | 153 |
| India | 5 | 2,264 | 7 | 3,152 | 451 |
| Spain | 3 | 1,218 | 3 | 386 | 267 |
Table 2: Countries ranked by the number of SHIP installations put up in 2019 (excludes Oman). The average size of these systems can vary significantly.
Source: Solar Payback SHIP Supplier Surveys 2018 and 2019
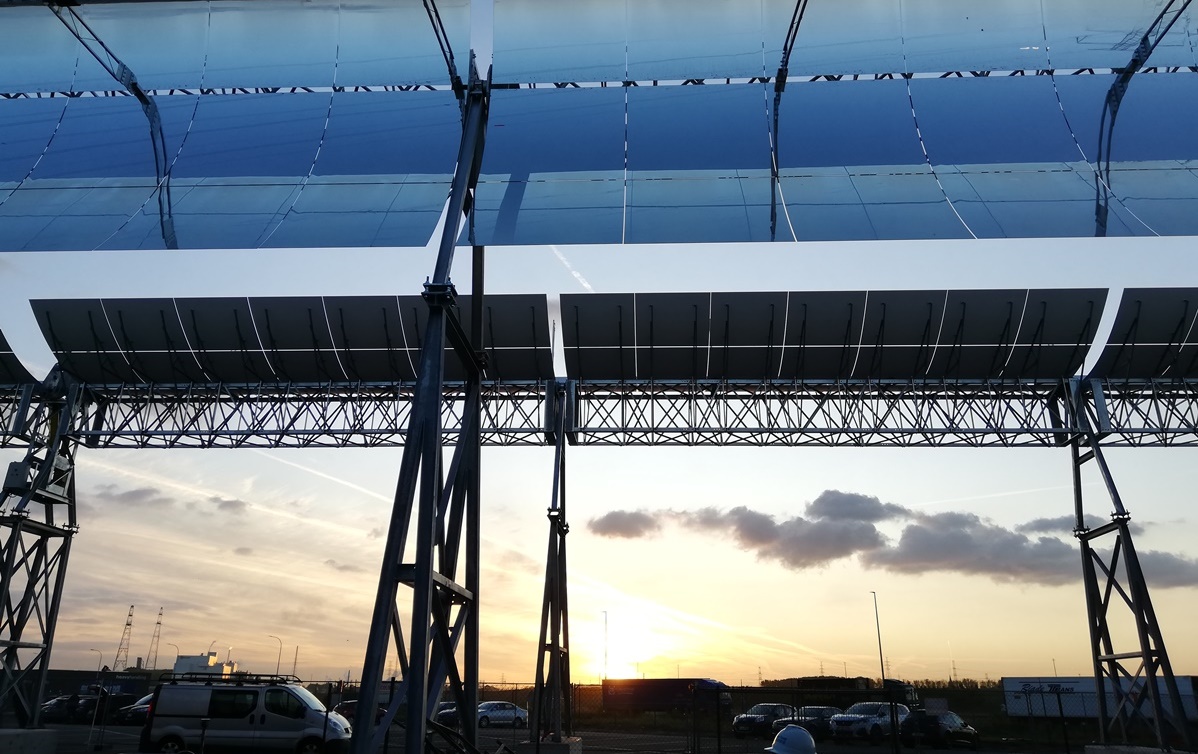
Chinese-based Linuo Paradigma alone listed 18 large systems totalling 48 MW, with an average size of 3,841 m². Glasspoint aside, this has been the highest annual capacity addition across all SHIP supplier surveys. US-based Glasspoint specialises in building extra-large solar steam-producing fields for the oil and gas industry. Its first project is the Miraah system in Oman. According to CCO Seti Gabriel, Glasspoint brought 180 MW of parabolic trough collectors online in Oman in 2019 and Miraah had 360 MW fully in operation by April 2020.
In contrast to 2019’s five top SHIP markets, which were China, Mexico, Germany, India and Spain (see table 2), only one or two industrial solar heat systems were commissioned in Belgium, France, the Netherlands, Turkey and the USA. In addition, Cyprus, Malaysia, Portugal, Saudi Arabia, and Senegal reported their first SHIP installation as part of a Solar Payback survey.

Largest new SHIP plants that were put up in 2019 and of which photos are available. Left: Inside the greenhouses Glasspoint put up a field of huge parabolic trough collectors in Oman’s desert. Middle: A 6.5 MW (9,300 m²) field of G2 Energy flat plate collectors provides heat for growing Freesias inside greenhouses in the Netherlands. Right: A 3.4 MW (4,099 m²) vacuum tube collector system that was installed by Himin and supplies thermal energy to the production processes of electronics manufacturer BOE Group in Wuhan, China.
Photos: Glasspoint, G2 Energy, Himin
Improved methodology
An improved methodology was developed for this year’s global SHIP survey, the fourth survey since 2016. For example, the month of commissioning, i.e., the month in which the system was brought online, was added to the template where technology suppliers fill in information about newly added SHIP plants. This new approach helped remove from the total count those projects that had not yet been commissioned but were still under development.
In addition, aggregated figures showing only the total number of commissioned SHIP plants and the cumulated collector area were not accepted. All technology suppliers provided lists of projects that included at least the system’s location and application, the collector type and the commissioning date. Listing the industrial client for which a specific system was installed was not mandatory, as many of the customers asked not to be named.
The 2020 survey also used the new SHIP definition developed and approved by the IEA Solar Heating and Cooling programme in November 2019 to standardise SHIP data across applications. In the agricultural and service sectors especially, the definition helps to draw a much clearer distinction between industrial and other uses. It also specifies a minimum size of 50 m² of collector area before a system can be considered in the world statistics, as smaller projects are often set up for demonstration purposes and they are difficult to track.
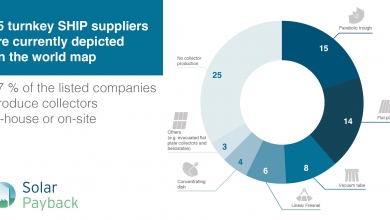
| SHIP collector area installed in 2018 [m2] | Percentage of total collector area put up in 2018 | SHIP collector area installed in 2019 [m2] | Percentage of total collector area put up in 2019 | |
| Vacuum tube | 31,563 | 57 % | 70,806 | 70 % |
| Flat plate | 11,414 | 21 % | 19,173 | 19 % |
| Parabolic trough | 11,096 | 20 % | 7,542 | 7 % |
| Dish | 1,075 | 2 % | 1,962 | 2 % |
| Air | 0 | 0 % | 1,046 | 1 % |
| Linear Fresnel | 360 | 1 % | 636 | 1 % |
| Total | 55,508 | 101,165 |
Table 3: SHIP installations in 2019 and 2018, broken down by collector type. The figures for the Miraah project in Oman are not part of this table.
Source: Solar Payback SHIP Supplier Survey 2019
As in previous years, vacuum tube collectors were the most popular collector technology for SHIP systems, making up as much as 70 % of the total SHIP collector area in 2019. The most popular sort of solar concentrating technology was again parabolic trough collectors, used in 12 projects in 2019 aside from Miraah in Oman. However, sales in that market sector fell slightly from 11,096 m² in 2018 to 7,542 m² in 2019. Solar dishes were put up by only two companies, Megawatt Solutions and Quadsun, both based in India. Likewise, linear Fresnel remained a niche technology installed by Belgian-based Rioglass and Spanish-based Solatom during four projects in 2019. Air collectors, which are used mainly in the agricultural sector, were added to the survey for the first time and were the main collector technology for SHIP projects supported by the German´s SHIP subsidy programme.