Supply chain maturity and economies of scale drive solar industrial heat costs down
Europe’s solar thermal industry has achieved quite significant cost reductions since 2014, with economies of scale at the project level helping to drive down costs, Michael Taylor, of the International Renewable Energy Agency (IRENA), said at a 9 March webinar titled Cheaper than Electrification: How solar heat will replace oil and gas in the EU industrial sector. His insights are based on a unique dataset that was set up within Solar Payback and includes the cost and performance characteristics of several hundred commercial solar heat systems put up across the continent.
Source: IRENA/Solar Payback
“We at IRENA have developed a very transparent approach to identifying the costs and performance of renewable electricity technologies. It forms the basis for grasping what role different technologies can economically play in the transformation of the energy market,” Taylor said. The approach has been the motivation behind IRENA’s collection of cost and performance data for 18 000 renewable power plants, with updated results published annually in IRENA’s Renewable Power Generation Cost Report. The overall aim is to provide up-to-date, comprehensive information on recent and near-term cost and performance trends, and understand the underlying drivers of differences in costs between technologies and markets, and their trends over time.
“The evidence we have from power generation and other technologies is the greater the transparency around costs, the more likely you are to get a buy-in from different stakeholders for targeted actions,” Taylor said. He added that the relative absence of cost and performance data on solar thermal systems is what led IRENA to partner with Solar Payback. “We see real added value from this approach, as our data is going to help inform policy makers and will assist modelers trying to incorporate different solar heat technologies into their scenarios,” he said.
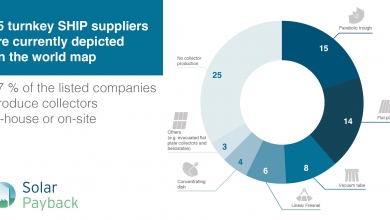
IRENA’s initial efforts have already yielded a database that contains more than 700 commercial solar heat projects commissioned in 16 countries around the world between 2010 and 2020. Totalling almost 800 MW, these plants are used for a variety of applications, ranging from solar district heating and solar process heat (SHIP) to central hot water distribution. “This is not yet final data. It’s subject to change,” Taylor noted, pointing to another round of data collection that is still ongoing that aims to plug some gaps in the database for some years and countries.
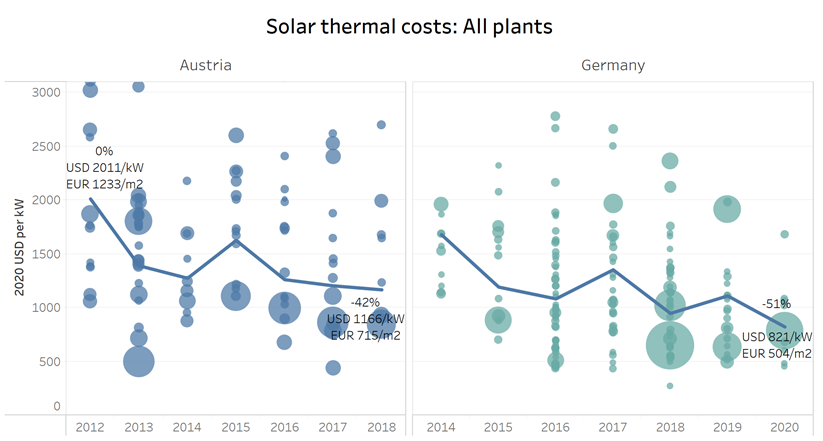
Figure 1: Total installed costs of projects commissioned in Austria and Germany between 2012 and 2020. Note: The diameter of each circle denotes project capacity in kW and the centre, the total installed cost on the Y-axis. The bold line represents the weighted-average installed costs for that country. The weighted average is calculated as a sum of the project costs times thermal capacity, divided by the sum of the thermal capacity.
Source: IRENA/Solar Payback
Installed costs in Austria and Germany – two comparatively mature commercial solar heat markets – dropped by 42 % and 51 % respectively and between 2012-18 and 2014-20 respectively (see fig. 1). Taylor said these reductions are quite impressive, considering the market for new commercial heat projects in both countries was fairly low. As a point of comparison, the cost of electricity from onshore and offshore wind dropped by 39 % and 29 % respectively between 2010 and 2019. Costs have fallen in Austria and Germany’s commercial heat markets thanks to technology improvements and an increasingly mature supply chain. The sector has also benefitted from some economies of scale at the project level in recent years, although installation sizes remain modest. Another factor helping to bring costs down has been the installation of a number of large plants with lower soft costs.
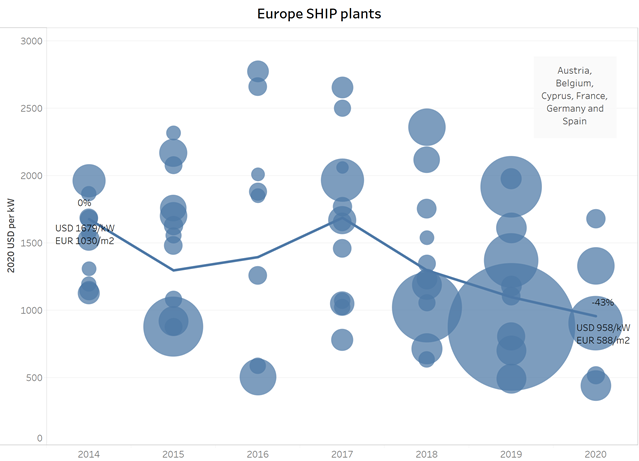
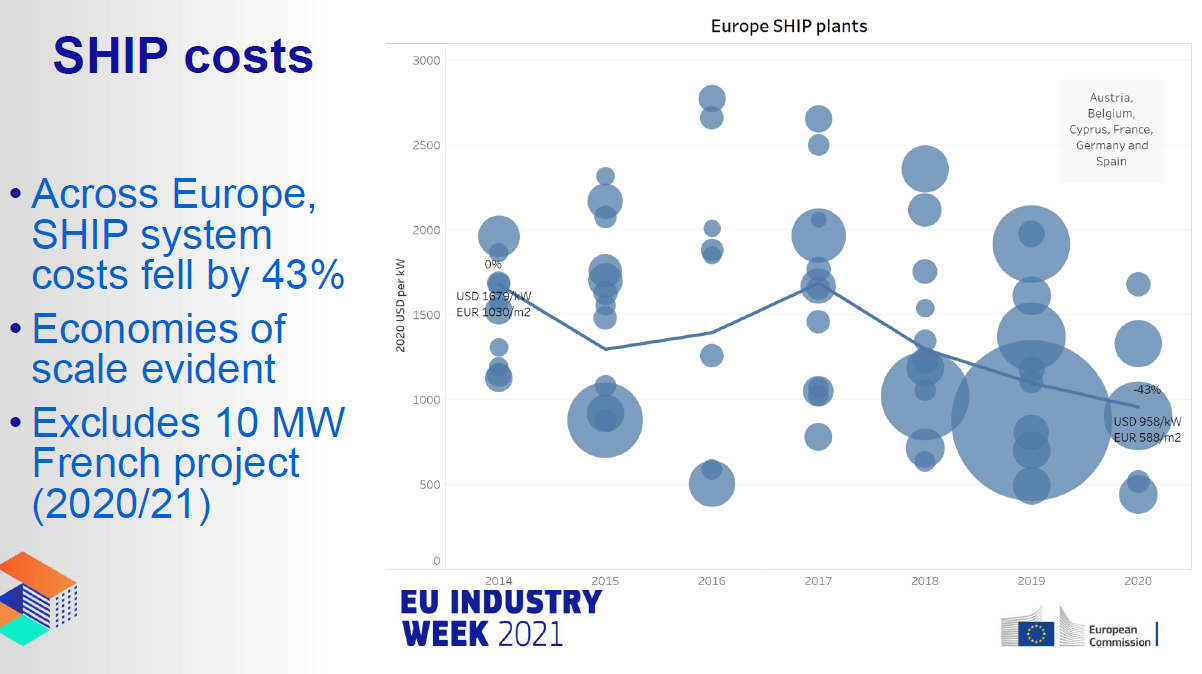
Figure 2: Levelised cost of heat (LCOH) of industrial solar heat plants commissioned in Europe from 2014 to 2020. Note: Care should be used in interpreting this chart, as it includes projects using different collector technologies and providing heat at different temperature levels. The LCOH was calculated with a weighted average cost of capital (WACC) of 5 %.
Source: IRENA/Solar Payback
Looking at the levelised cost of heat (LCOH), the SHIP market – although still a smaller data set of 77 projects – has seen costs drop by as much as 58 % between 2014 and 2020 (see fig. 2). Economies of scale have clearly had an impact since 2018, as more and more developers began putting up large-capacity systems, Taylor explained.
“We have identified two important drivers of cost reduction, namely an increasingly mature domestic market and growing economies of scale. The second is most evident when looking at the solar district heating market in Europe,” he added before pointing to figure 3 during his presentation.
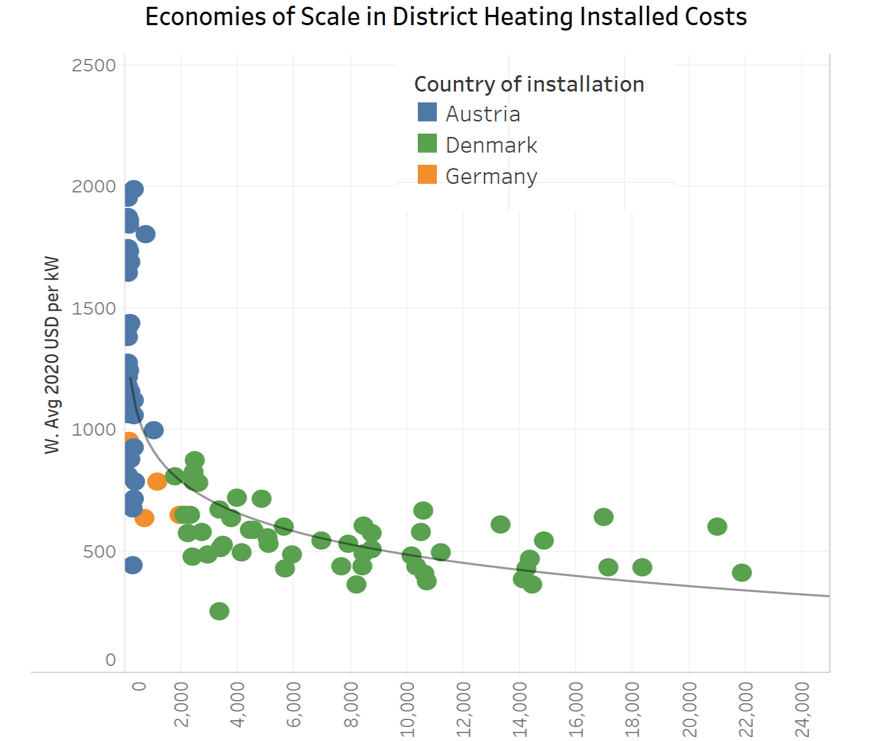
Figure 3: Weighted average installed costs [USD/kW] of differently sized (kW on the x-axis) solar district heating plants in Austria, Germany and Denmark (93 systems providing 542 MWth in all).
Source: IRENA/Solar Payback
Figure 3 shows the very competitive cost base of the Danish solar heat market. The more competitive costs in Denmark are driven by the economies of scale from larger, ground-mounted fields, and the mature and competitive nature of the local market. Austria, by contrast, has a lot of smaller, roof-mounted SDH plants, which can be up to four times as expensive.
When asked about what politicians should take away from his solar heat cost analysis, Taylor stressed the importance of large projects. ”We need to make policymakers aware that targeting some of the larger applications will drive down costs faster by increasing learning-by-doing and economies of scale in manufacturing, which will lead to small-scale applications becoming more competitive as well.”
However, he also said that there is little data available for some regions, mainly because the market is still emerging or, in other cases, because it is rather difficult to figure out what the actual cost drivers are. He concluded: “I think there’s quite a bit more work that needs to be done by policy makers and industry to kind of support not only the development but also a better data exchange, to understand where the opportunities are.”
The webinar Cheaper than Electrification: How solar heat will replace oil and gas in the EU industrial sector was organised by Solar Heat Europe as part of the EU industry Week. A recording and all presentations of the workshop are available for download at http://solarheateurope.eu/2021/03/09/materials-cheaper-than-electrification-how-solar-heat-will-replace-oil-and-gas-in-the-eu-industrial-sector/